Analysis

-
 4.8K
4.8KBreaking down Michigan’s zone defense
Michigan’s zone defense has gone from an occasional wrinkle to a staple over the first month of the Big Ten season. Today...
-

 3.1K
3.1KA closer look at Michigan’s early struggles
Michigan sits at 6-3 after losing back-to-back home games to mid-majors. Here's a closer look inside the numbers at what has caused...
-
2.4K
Mid-range game critical to evolution of Caris LeVert
Everybody hates the mid-range jumper. Iowa State has nearly eliminated it from its offense. Daryl Morey has tried to do something similar...
-

 4.3K
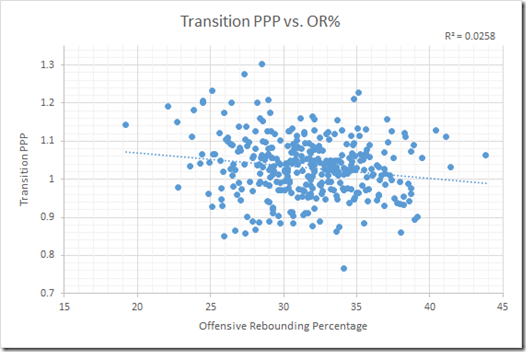
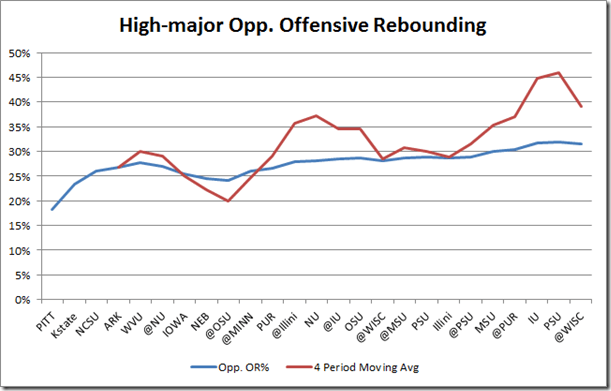
4.3KDoes offensive rebounding affect transition defense?
John Beilein teams have never been renowned for their ability to crash the offensive glass. Last year the Wolverines jumped 100 spots...
-

 2.9K
2.9KScouting Syracuse
Michigan will face Syracuse’s vaunted 2-3 zone in the Final Four on Saturday but the Wolverines will also have to stop a...
-

 2.9K
2.9KSix and Six: Thoughts on Michigan’s slump
Dustin Johnston Michigan enters the opening round of the NCAA tournament with more questions than answers. The Wolverines clearly still have ability...
-

 3.1K
3.1KBy the Numbers: Trey Burke vs. Nate Wolters
Trey Burke versus Nate Wolters is the sort of guard match up that jumps off the page. Two of the top four...
-

 5.8K
5.8KBehind the Numbers: BLOBs, SLOBs and Timeouts
Dustin Johnston Much of the focus on Michigan this season has revolved around the Wolverines tremendous transition offense, Trey Burke’s player of...
-
 3.2K
3.2KGraphing the Big Ten season to date
The Only Colors started a tradition of plotting game-by-game efficiency numbers and applying third order polynomial regressions to track every Big Ten teams’...
-
3.0K
Examining the Defense: Ball screens and zone
Michigan’s defense is the primary concern after a frustrating five game stretch. The Wolverines have seen their offensive production hit occasional snags...
-

 3.0K
3.0KFirst Look: Michigan at Indiana
Dustin Johnston There is a big game Saturday and one preview isn’t enough. Here’s a first look at Indiana featuring some random...