At this point, any analytically savvy basketball fan knows that three-pointers and shots at the rim are the most efficient shots on the floor.
The NBA has emphasized this trend over the last few years and the college game isn’t far behind. The value of any shot at the rim or from beyond the three-point line is greater than a 16-foot jumpshot, so it only makes sense to take more of them.
The expected value of a shot at the rim in the college game is 1.18 points per attempt and three-pointers are worth 1.03 points per attempt. Compare that to a mid-range jump shot which is worth only .71 points per shot. Teams that can minimize two-point attempts and still run effective offense have a decided advantage over teams that don’t.
Some teams in the college game have already mastered this art — last year Northern Iowa, Duke, Notre Dame, Marquette, Indiana and Boston College were a few that maximized their efficient attempts — but others like Pittsburgh, Rutgers, California and North Carolina haven’t quite gotten that far.
But how has this statistical battle played out in the Big Ten? Running the numbers, courtesy of Shot Analytics, several trends emerge.
Indiana leads the conference in percentage of ‘good shots’ attempted while Michigan State, Minnesota and Ohio State shoot the highest percentage on their ‘good shot attempts’. Maryland and Wisconsin rank second and third in shot selection by this metric (percentage of layup and three-point attempts, or non mid-range two-point attempts).
The following graphs are all designed so that the upper-right quadrant is ideal (click to view full screen). Note: All data is from the 2014-15 college basketball season.
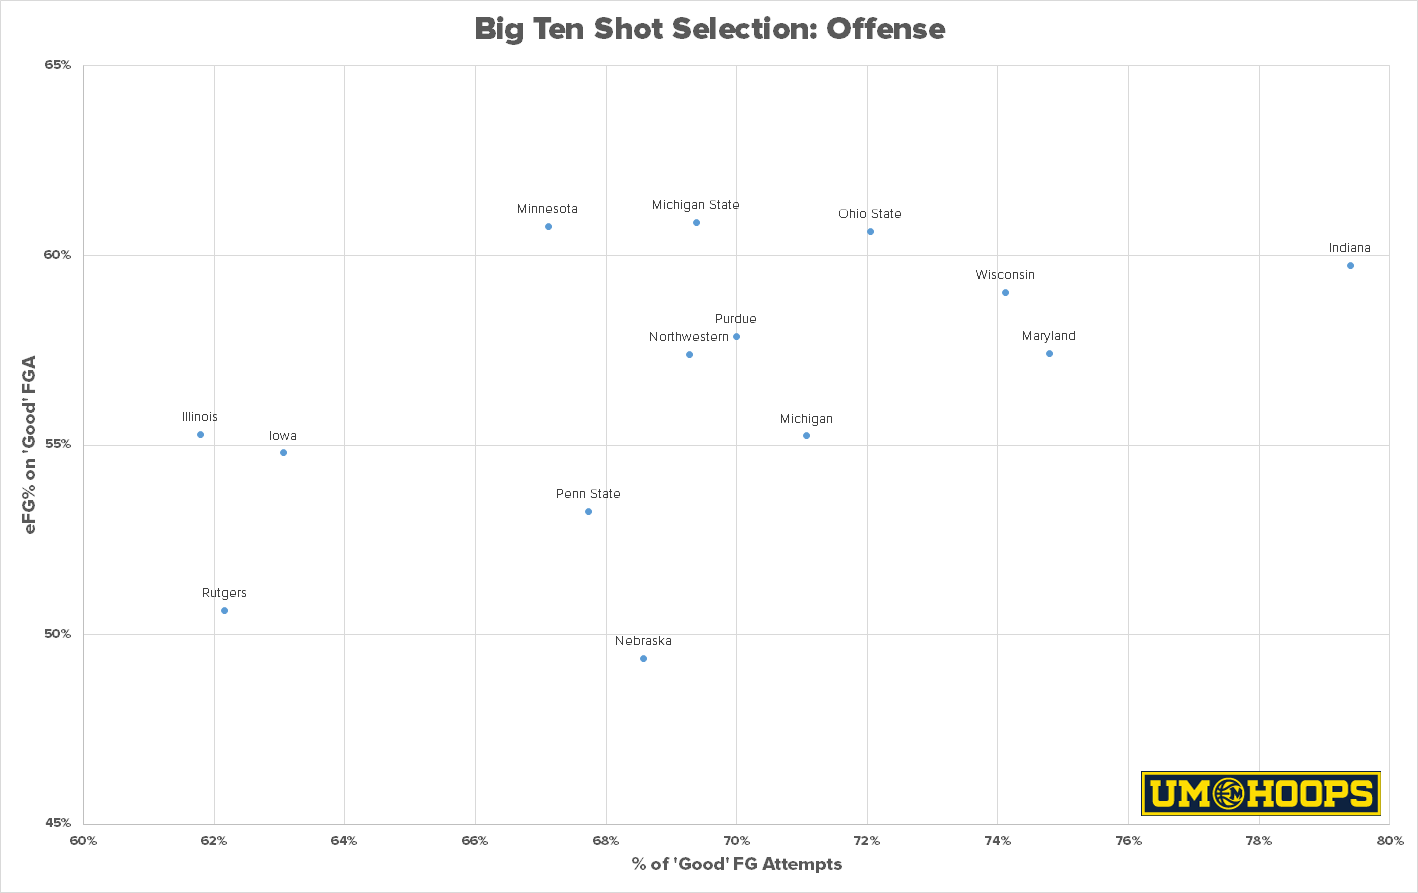
Michigan falls in the middle of the pack, attempting around 71% of its field goals from the positive expected value zone with a 55 eFG% on those attempts. Those numbers aren’t bad, but they aren’t great either. The previous year, when the Wolverines had the best offense in the country, Michigan took 74.5% of its field goals from the +EV zone (3rd in the conference) and connected for a 62.1 EFG% (1st in the conference).
That’s a fairly significant jump in attempts and efficiency. The majority of that gap is explained by attempts at the basket. Michigan shot 57% at the rim in 2014-15 and attempted only 30% of its field goals at the basket. In 2013-14, the Wolverines made 65% of their close twos and attempted 34% of their field goals within six feet.
That is the difference between an elite offense and a mediocre one and a major reason why finding an effective baseline finisher (a la Glenn Robinson III) and a productive center is near the top of Michigan’s wish list this offseason.
Rutgers, Illinois and Iowa are the three teams in the conference that are flat out doing it wrong. All three teams continue to fire up poor shot attempts at an alarming rate. Iowa is the exception in this group in the sense that the Hawkeyes managed to have an efficient offense despite shooting a lot of mid-range jumpers. The Hawkeyes’ collection of length combo forwards and wings in the Aaron White, Jarrod Uthoff mold could help explain some of this productivity while Illinois and Rutgers had two of the league’s four worst offenses.
Defensively, Wisconsin forces the most ‘bad shots’ among conference teams. The Badgers have been known for funneling opponents into difficult mid-range jumpers around the free throw line for years and the metrics back up that fact. Purdue is another team that makes an appearance in the upper right quadrant of this graph thanks to its terrific interior defense. It’s no coincidence that the Boilermakers had one of the league’s best defenses last season. Note: All data is from the 2014-15 college basketball season.
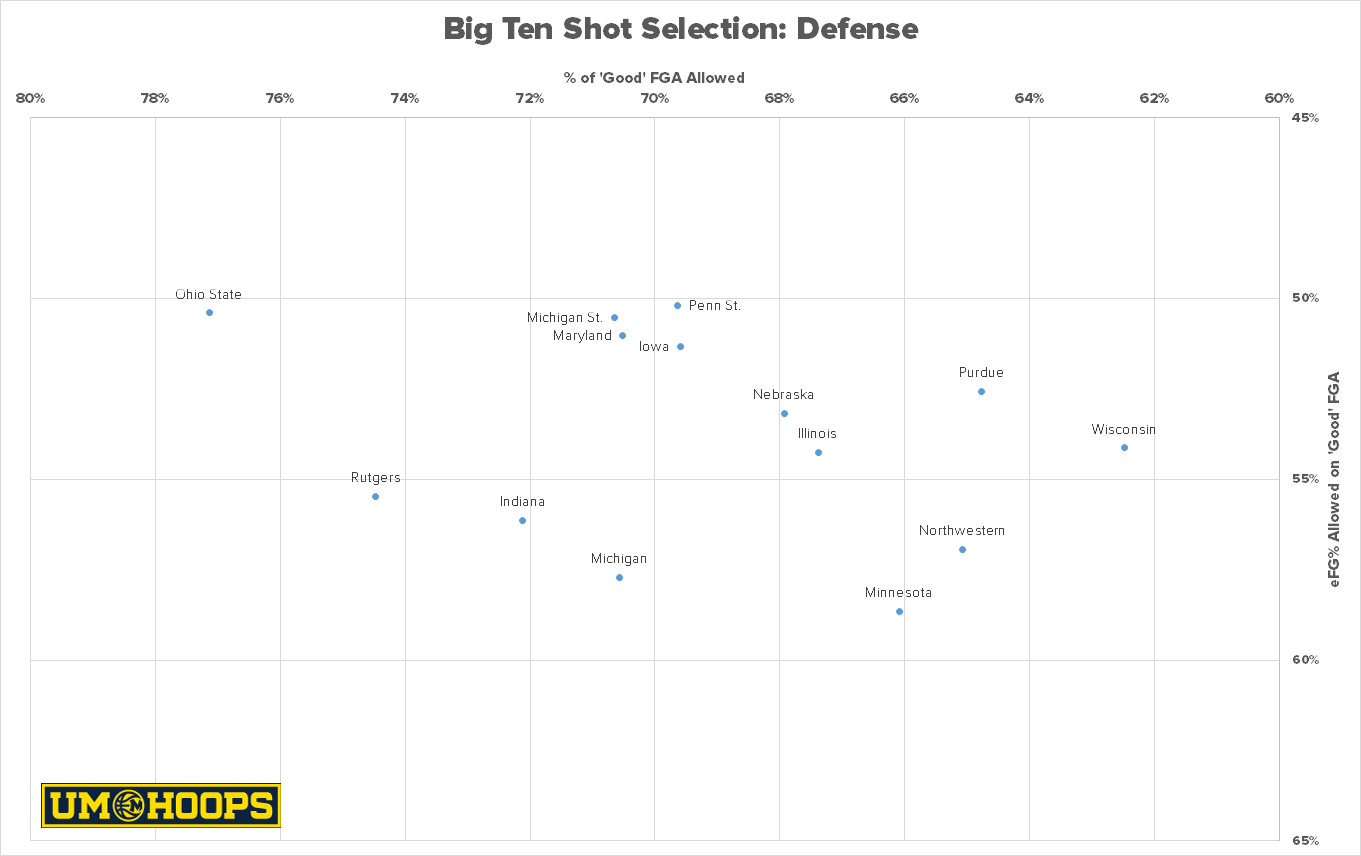
Ohio State is one of the more intriguing teams on the defensive plot. The Buckeyes allowed more rim and three-point attempts than any team in the conference, but had one of the best eFG% defense on those attempts. Ken Pomeroy’s research taught us that three-point defense beyond limiting attempts is relatively random. Ohio State did have a strong interior presence defensively, but still be a candidate for defensive regression with the graduation of key big men and the large portion of 3PA allowed.
So what team maximizes good shots for its offense and minimizes good shots for the opponent? The league’s consistent leader: Wisconsin.
The next scatterplot shows percentage of good shots on offense on the x-axis and percentage of good shots allowed on the y-axis. Again the ideal quadrant of this graph is the upper-right where only Wisconsin has attempted more than 70% good shots and allowed fewer than 70%. Note: All data is from the 2014-15 college basketball season.
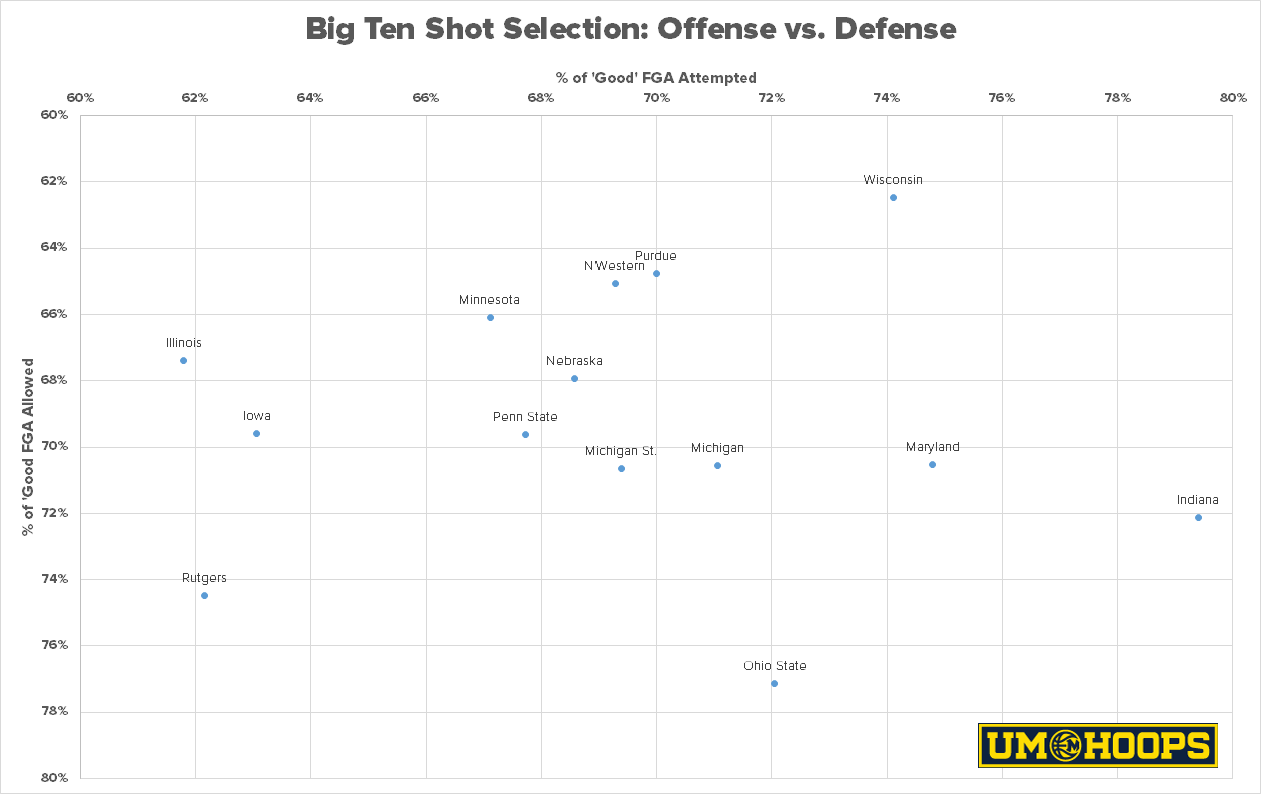
Here we see Michigan right in the middle of the pack. The Wolverines fall almost directly at 70% in both metrics which leaves them right around Michigan State. For the Wolverines, a movement toward fewer mid-range attempts seems more likely than an improvement on the defensive end.
Michigan has a vast collection of three-point shooters and should be able to create more spacing for players like Derrick Walton and Caris LeVert to attack the rim. LeVert has historically struggled to hit mid-range shots, so figuring out ways him to end up with layups or threes should be an early focus of the Michigan offense.
Defensively, Michigan’s improvement in these metrics will depend on its interior play. The Wolverines had poor defense around the rim last season which is a problem in itself, but also leads to double-teams and over-helping, which then lead to more three-point attempts.
Either way, we’ll be sure to track these numbers throughout the season.
Hat tip to Seth Partnow of Nylon Calculus for inspiration and creating these graphs in the NBA.